A curated guide to data on children and youth with special health care needs (CYSHCN) in San Francisco. Find trusted sources across healthcare, education, and developmental services, with direct links to the reports that matter most.
Explore Data by Topic
Each source includes a short description, the most recent year of data available, and tips for finding what you need. Some sources are updated more often than others, so check the date on each.
Table of Contents
San Francisco Overall
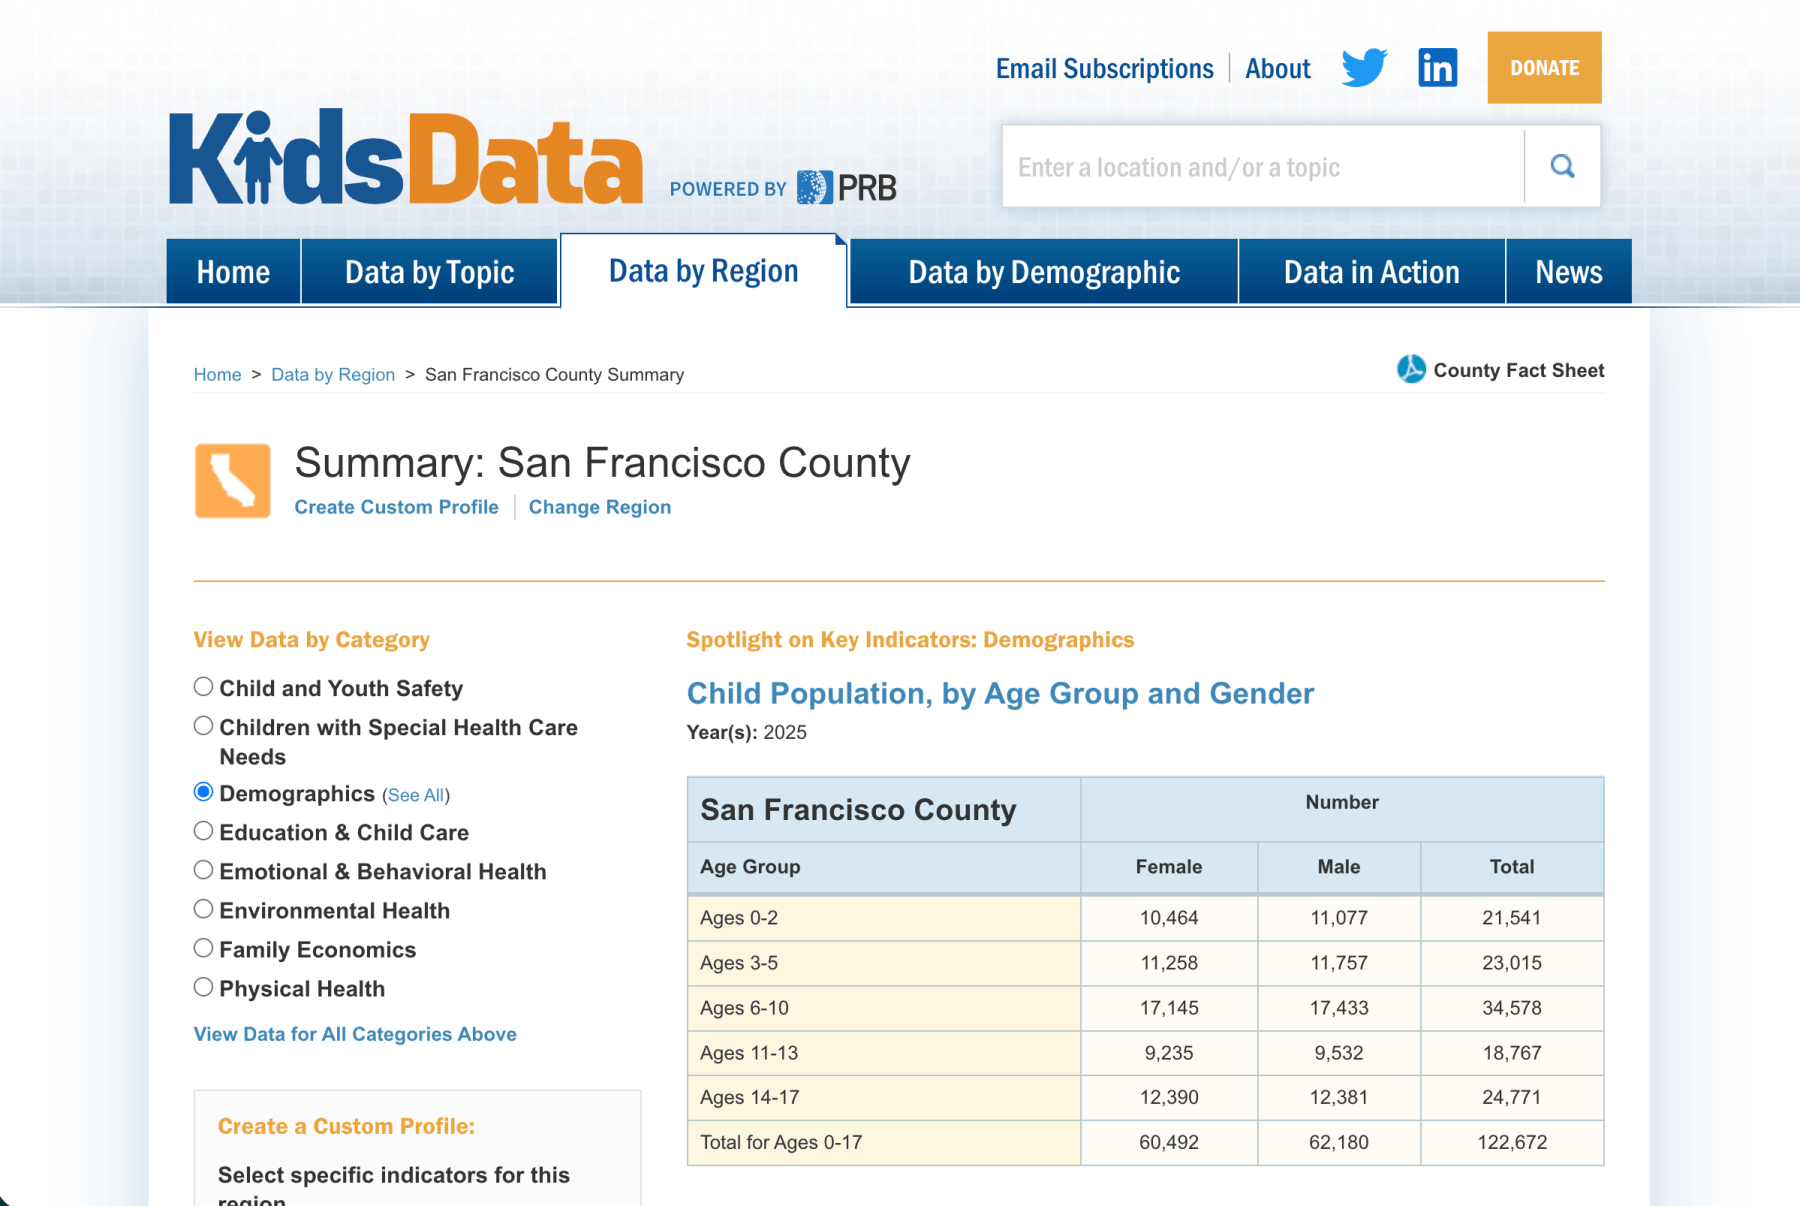
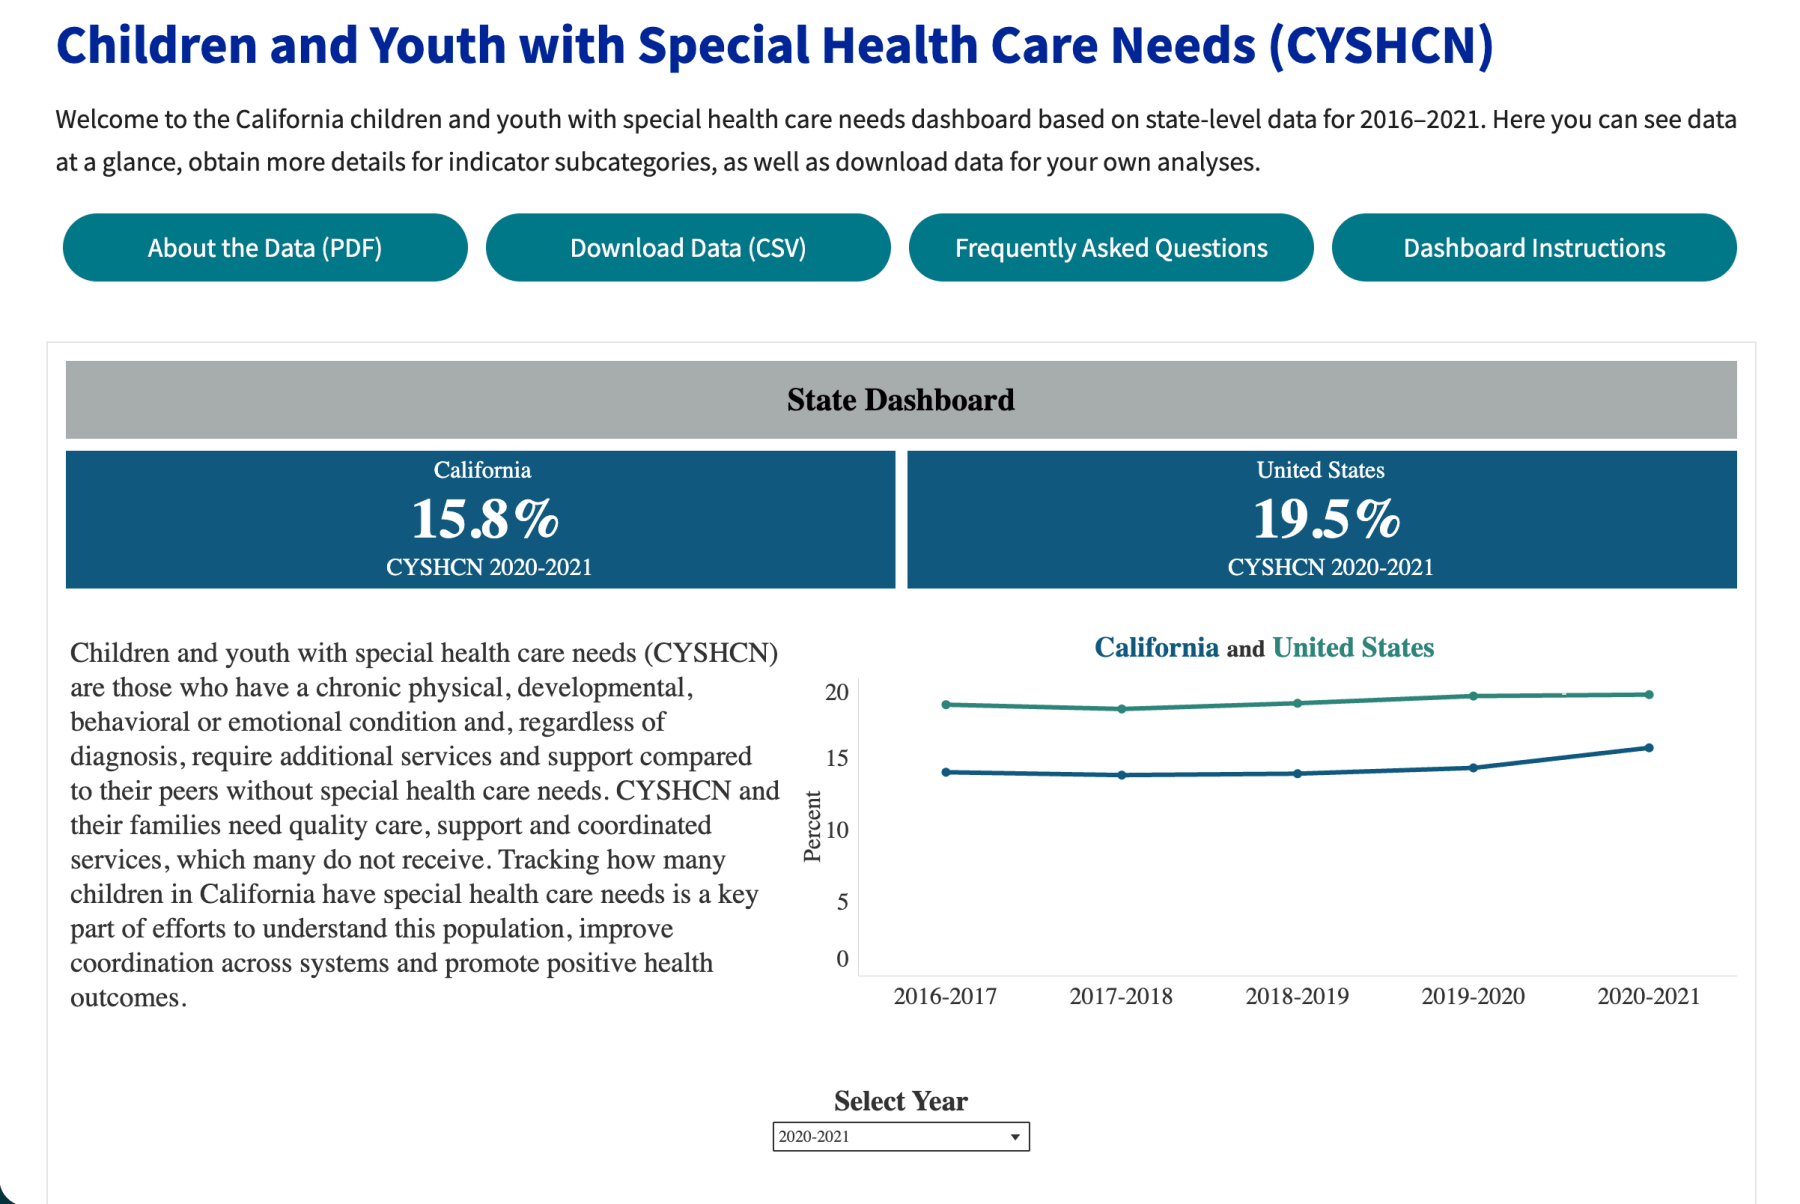
KidsData Summary for San Francisco County
Review overall data about the health and well being of children in San Francisco County, including general demographic data, to understand broad context.
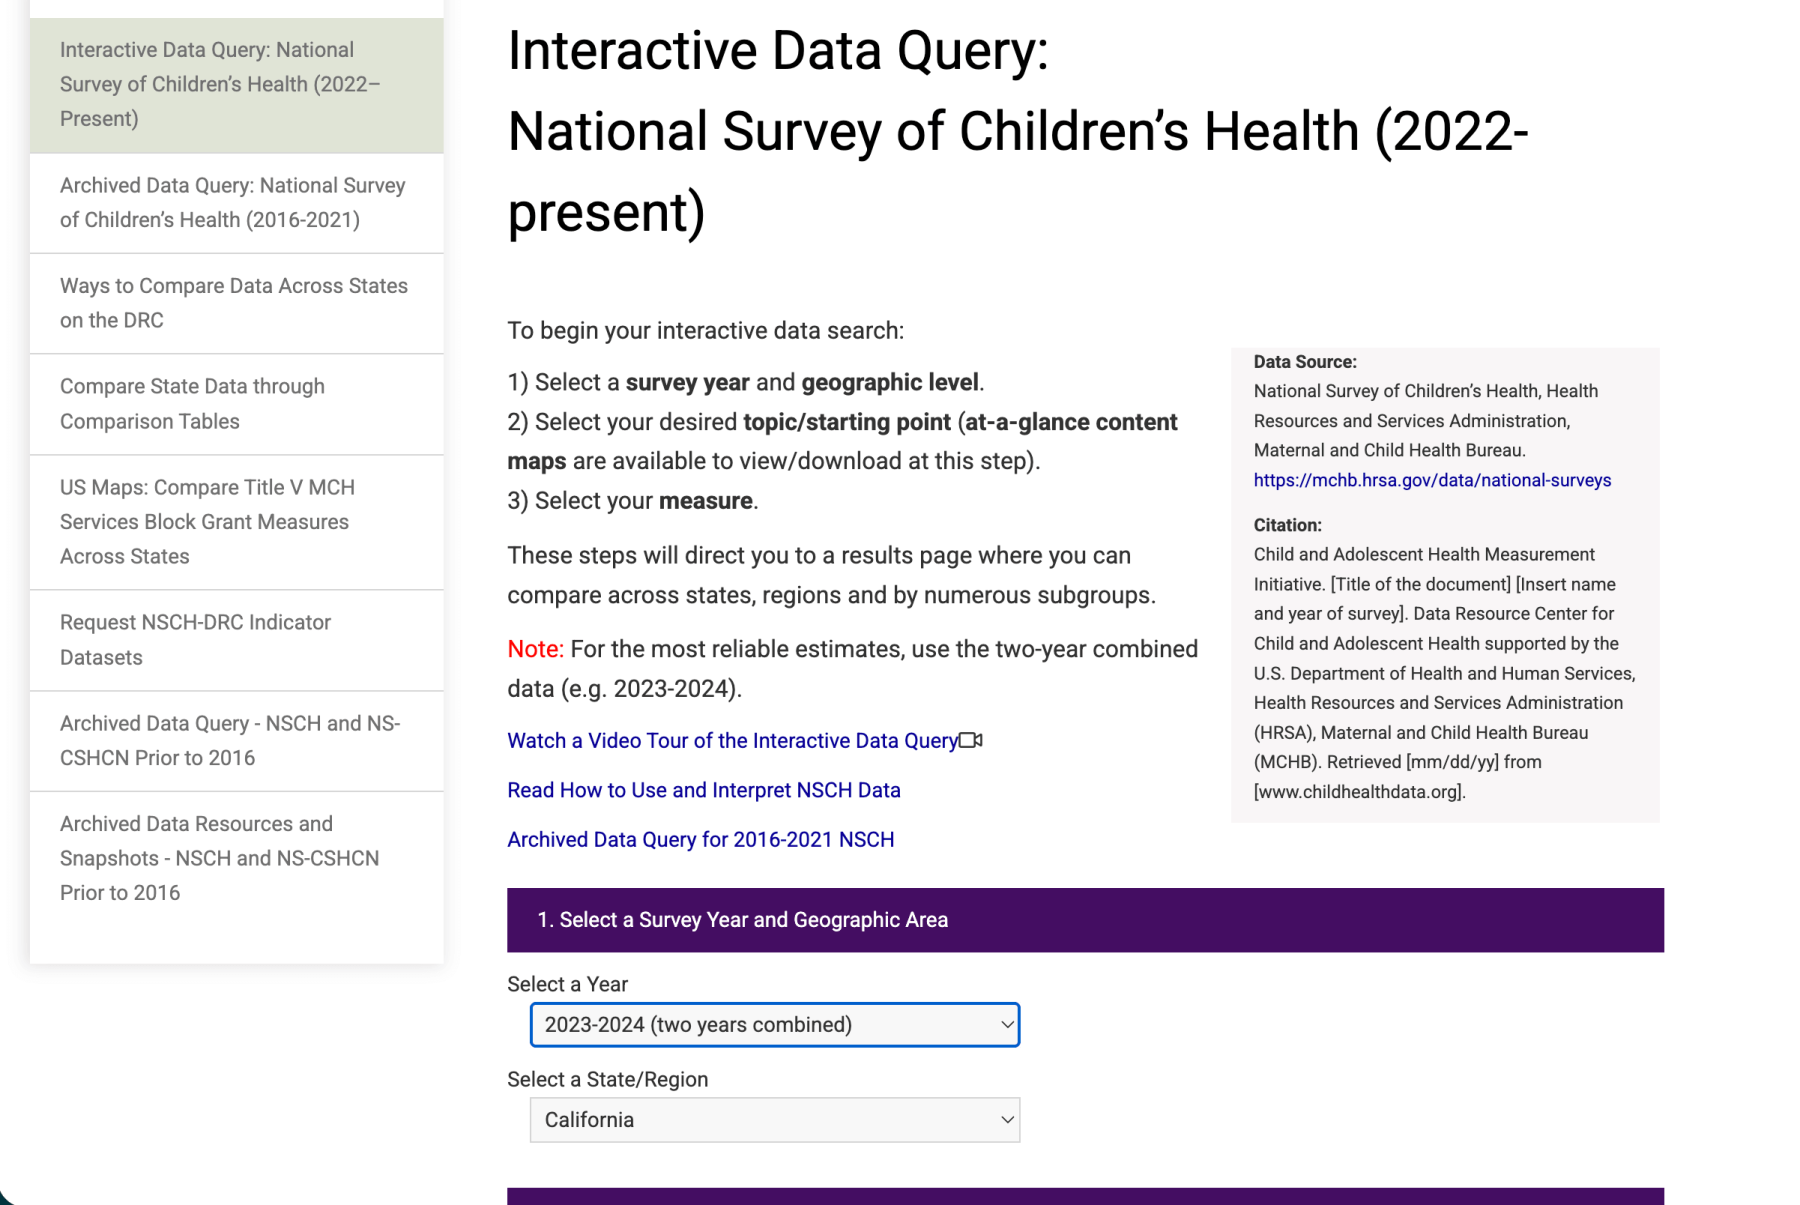
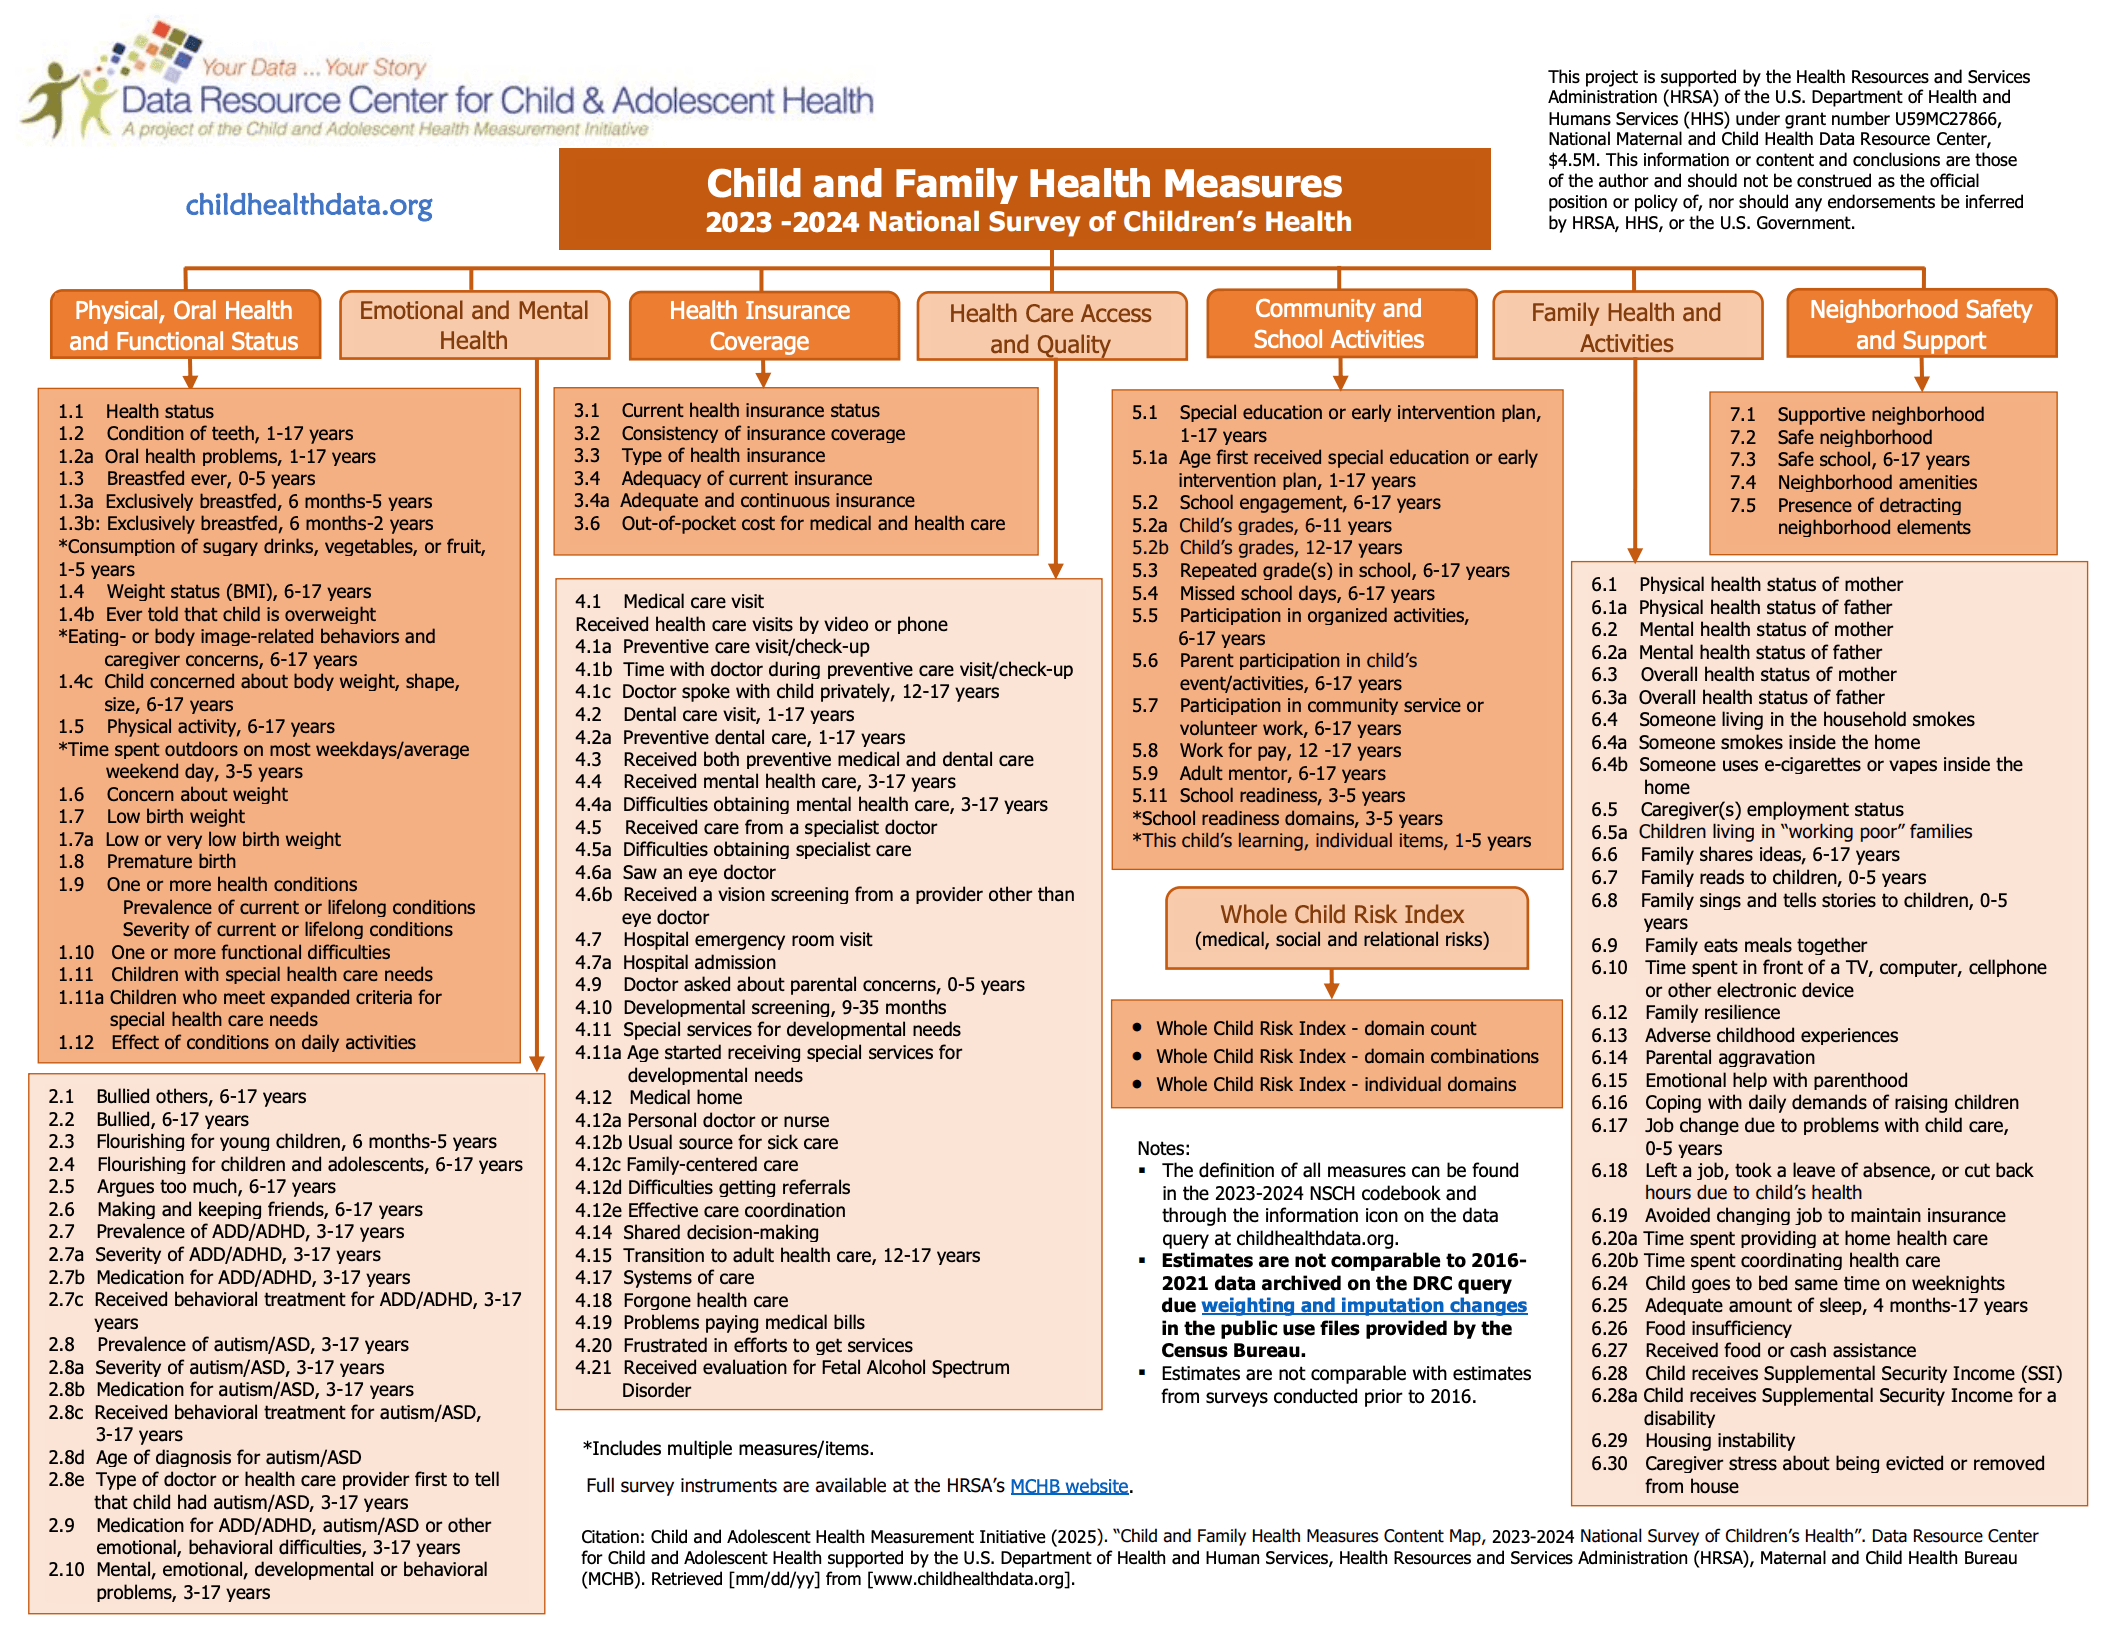
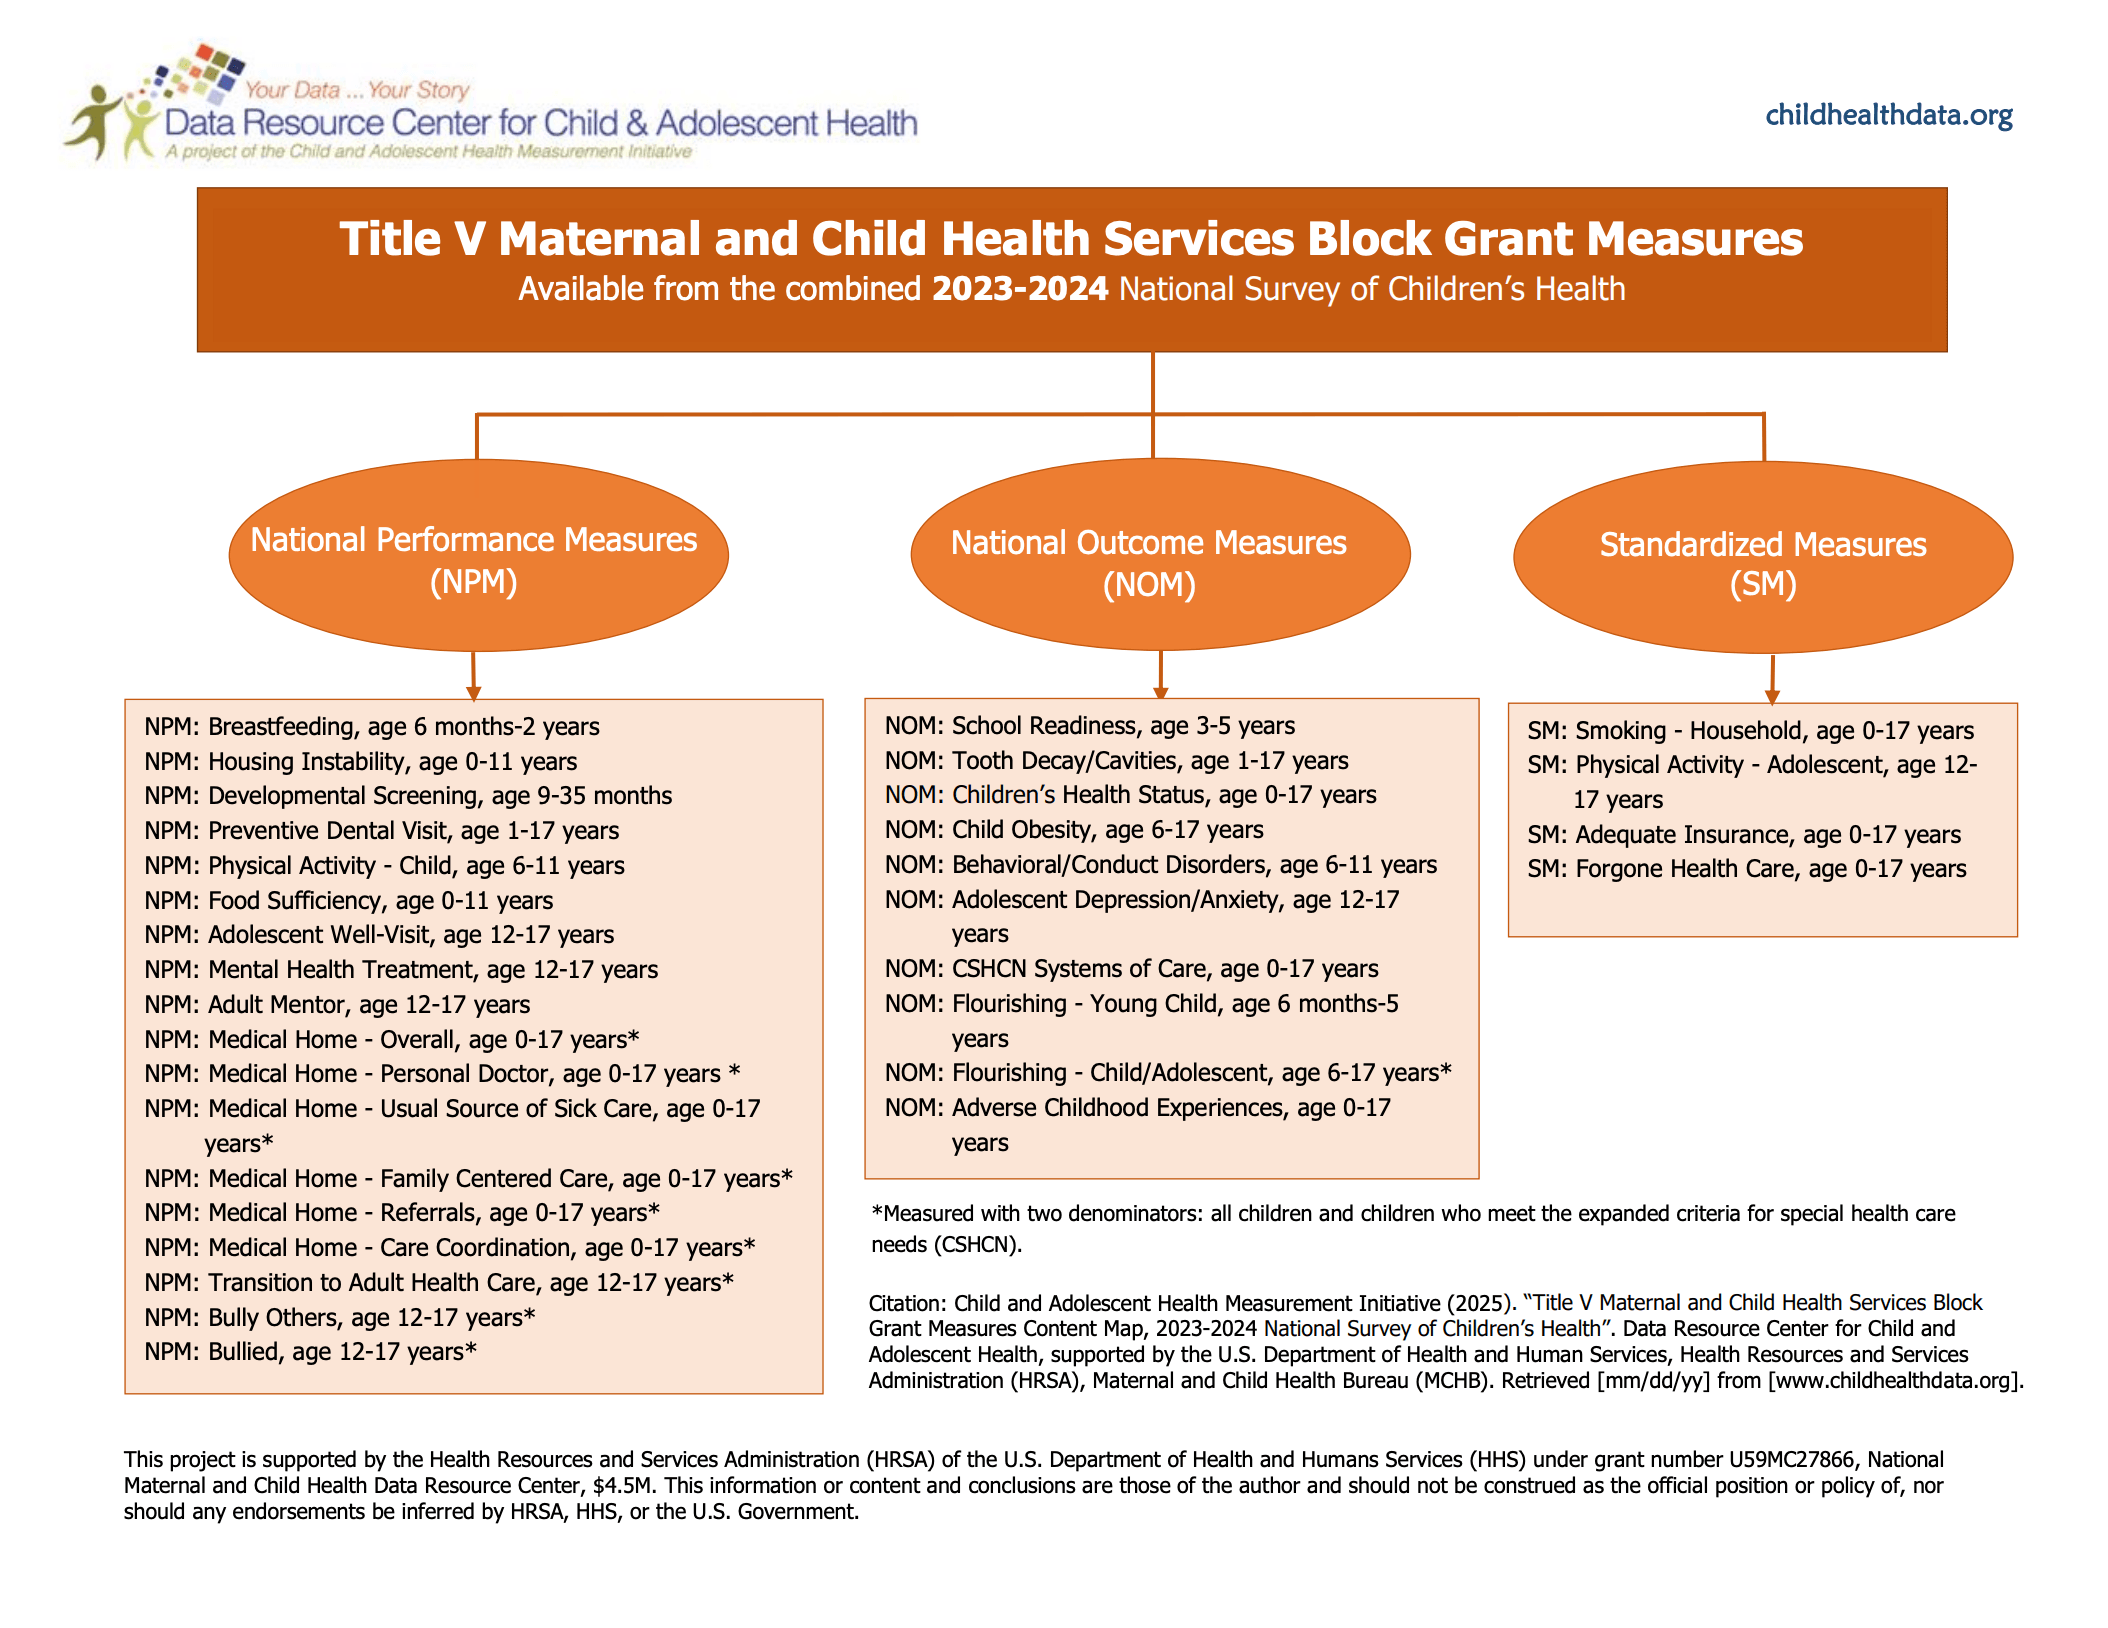
Explore an extensive data set covering multiple, intersecting aspects of children’s lives — including physical and mental health, access to and quality of health care, and the child’s family, neighborhood, school, and social context (data available at the state level, not by county).
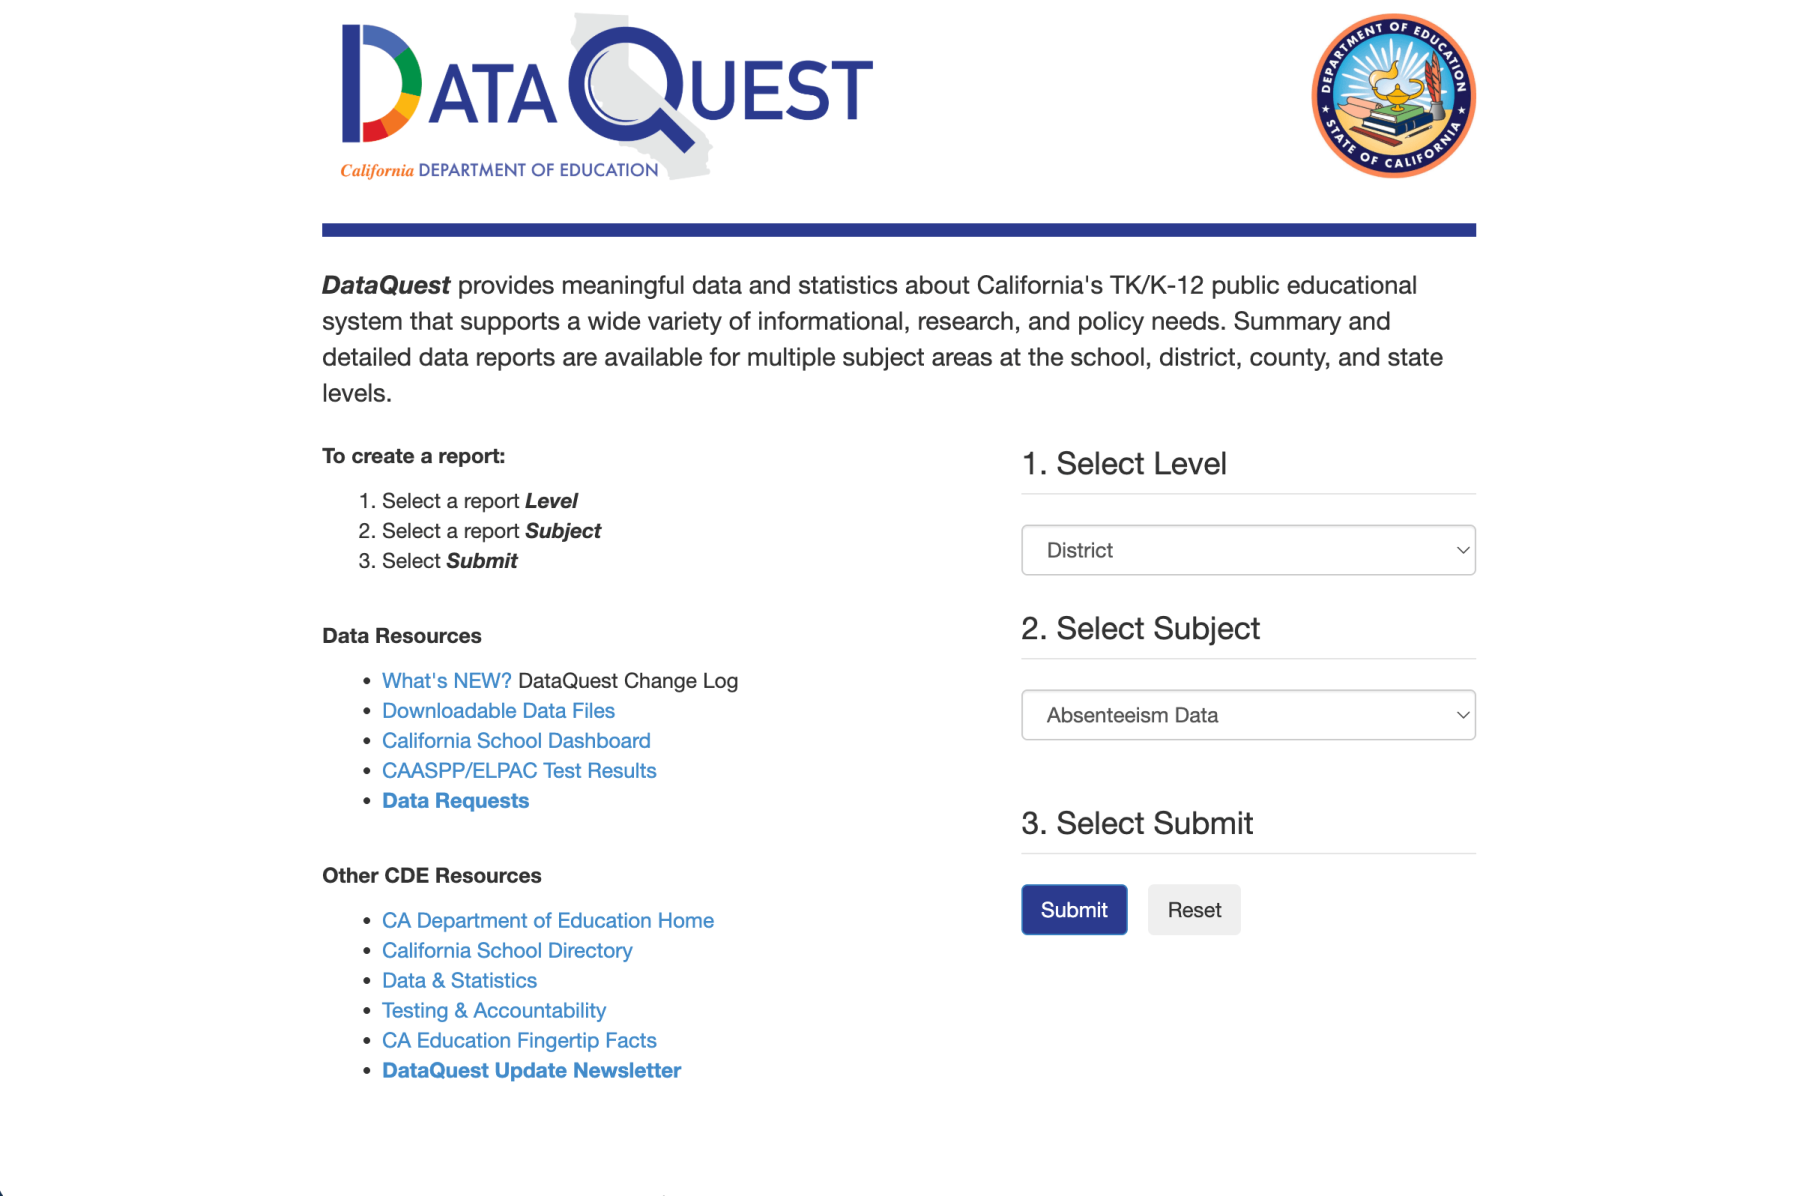
Data Quest from the California Department of Education (CDE)
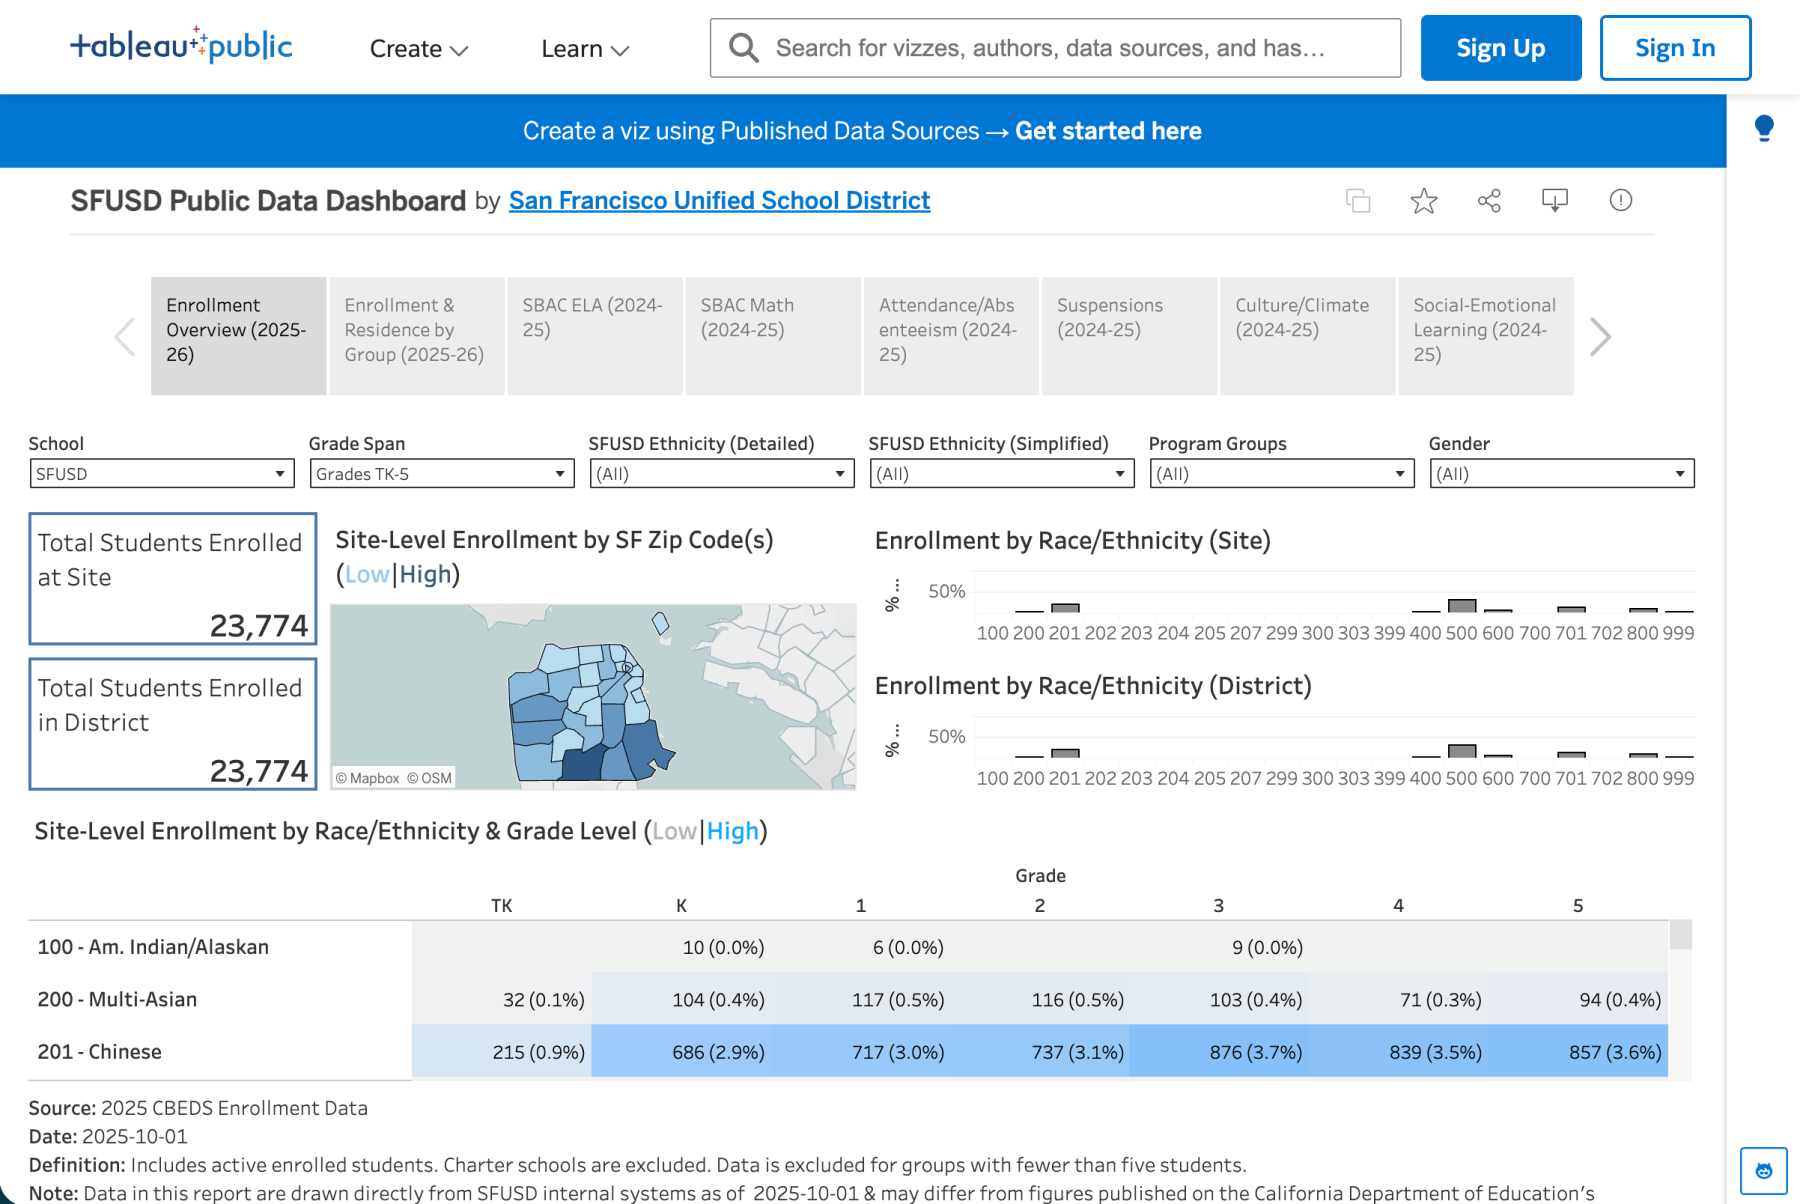
Explore a wide variety of reports from the California Department of Education (CDE) that shows data specifically for SFUSD and their Special Education program.
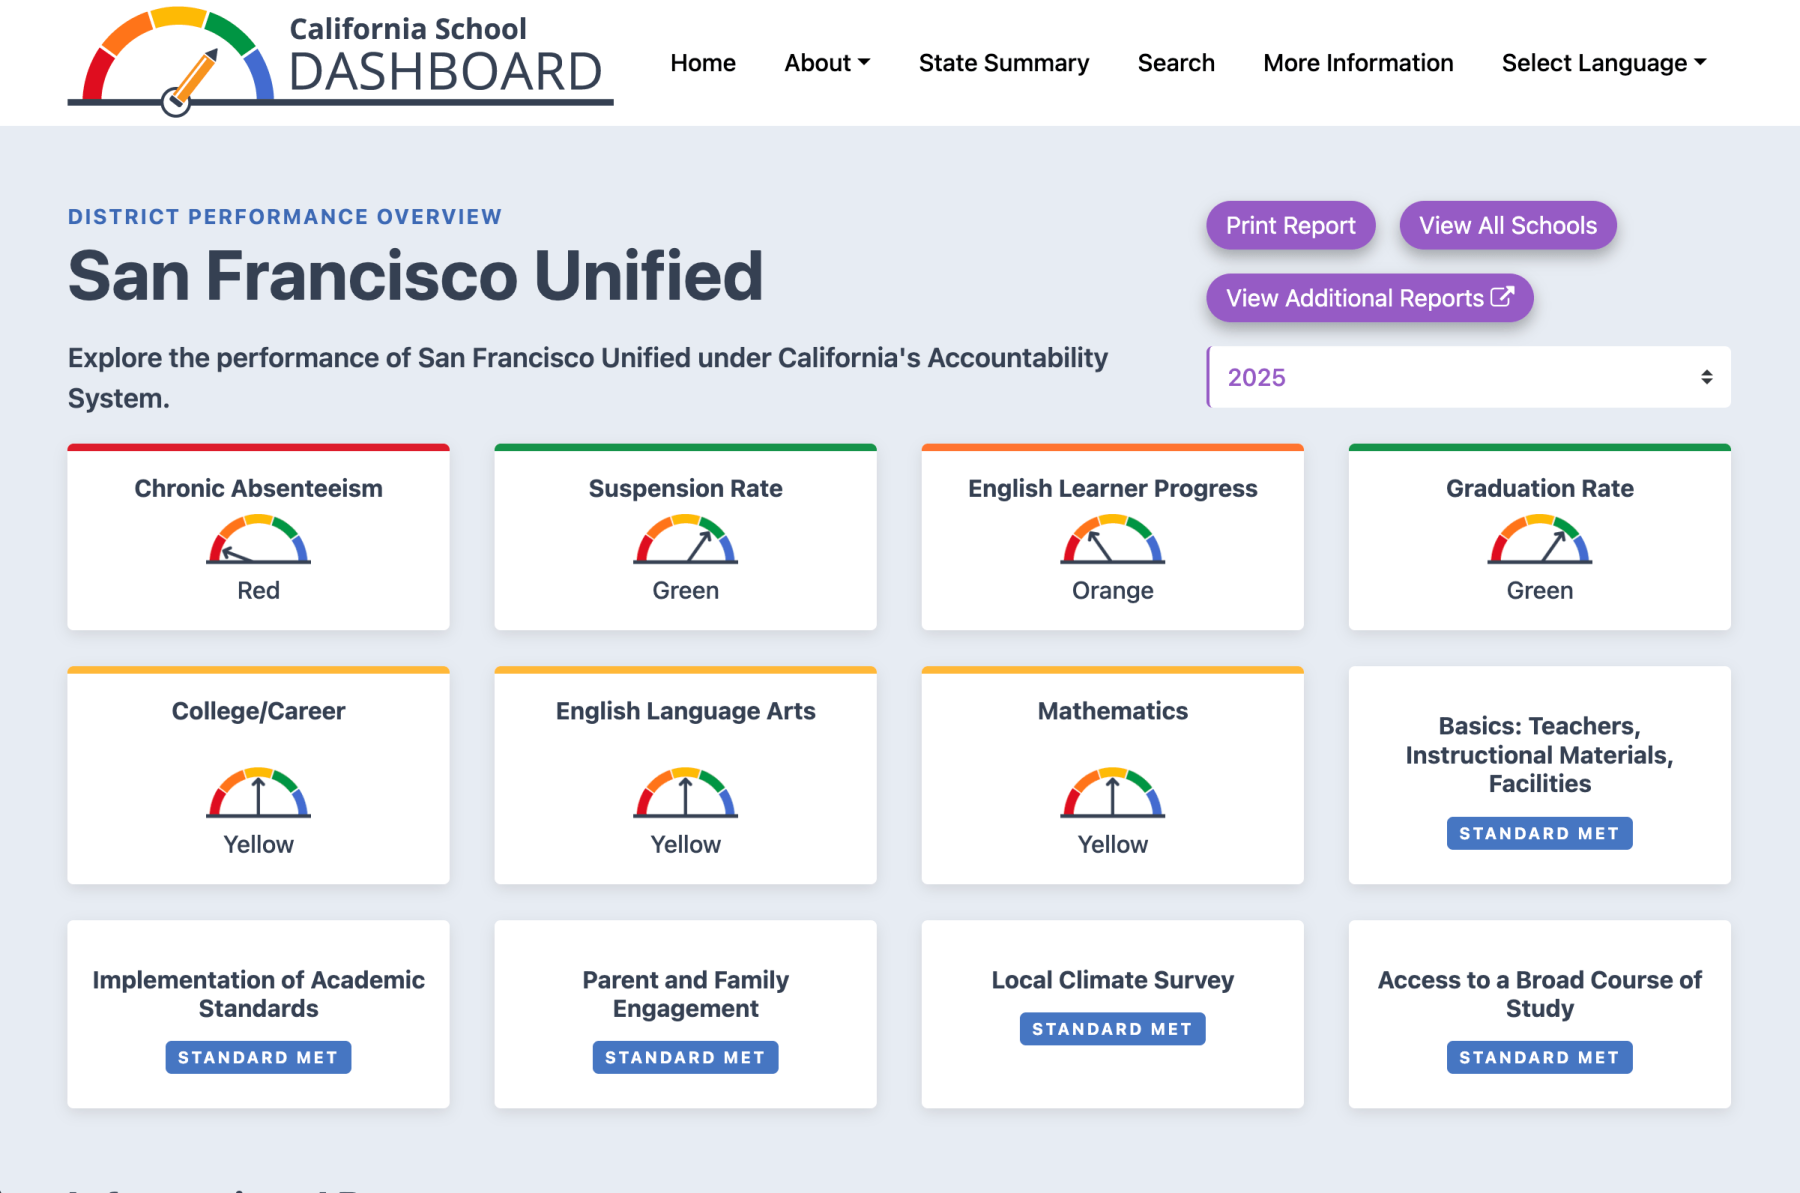
View SFUSD’s performance on the state’s school accountability indicators, including test scores, graduation, chronic absenteeism, and suspension rates, with results broken out by student group, including Students with Disabilities.
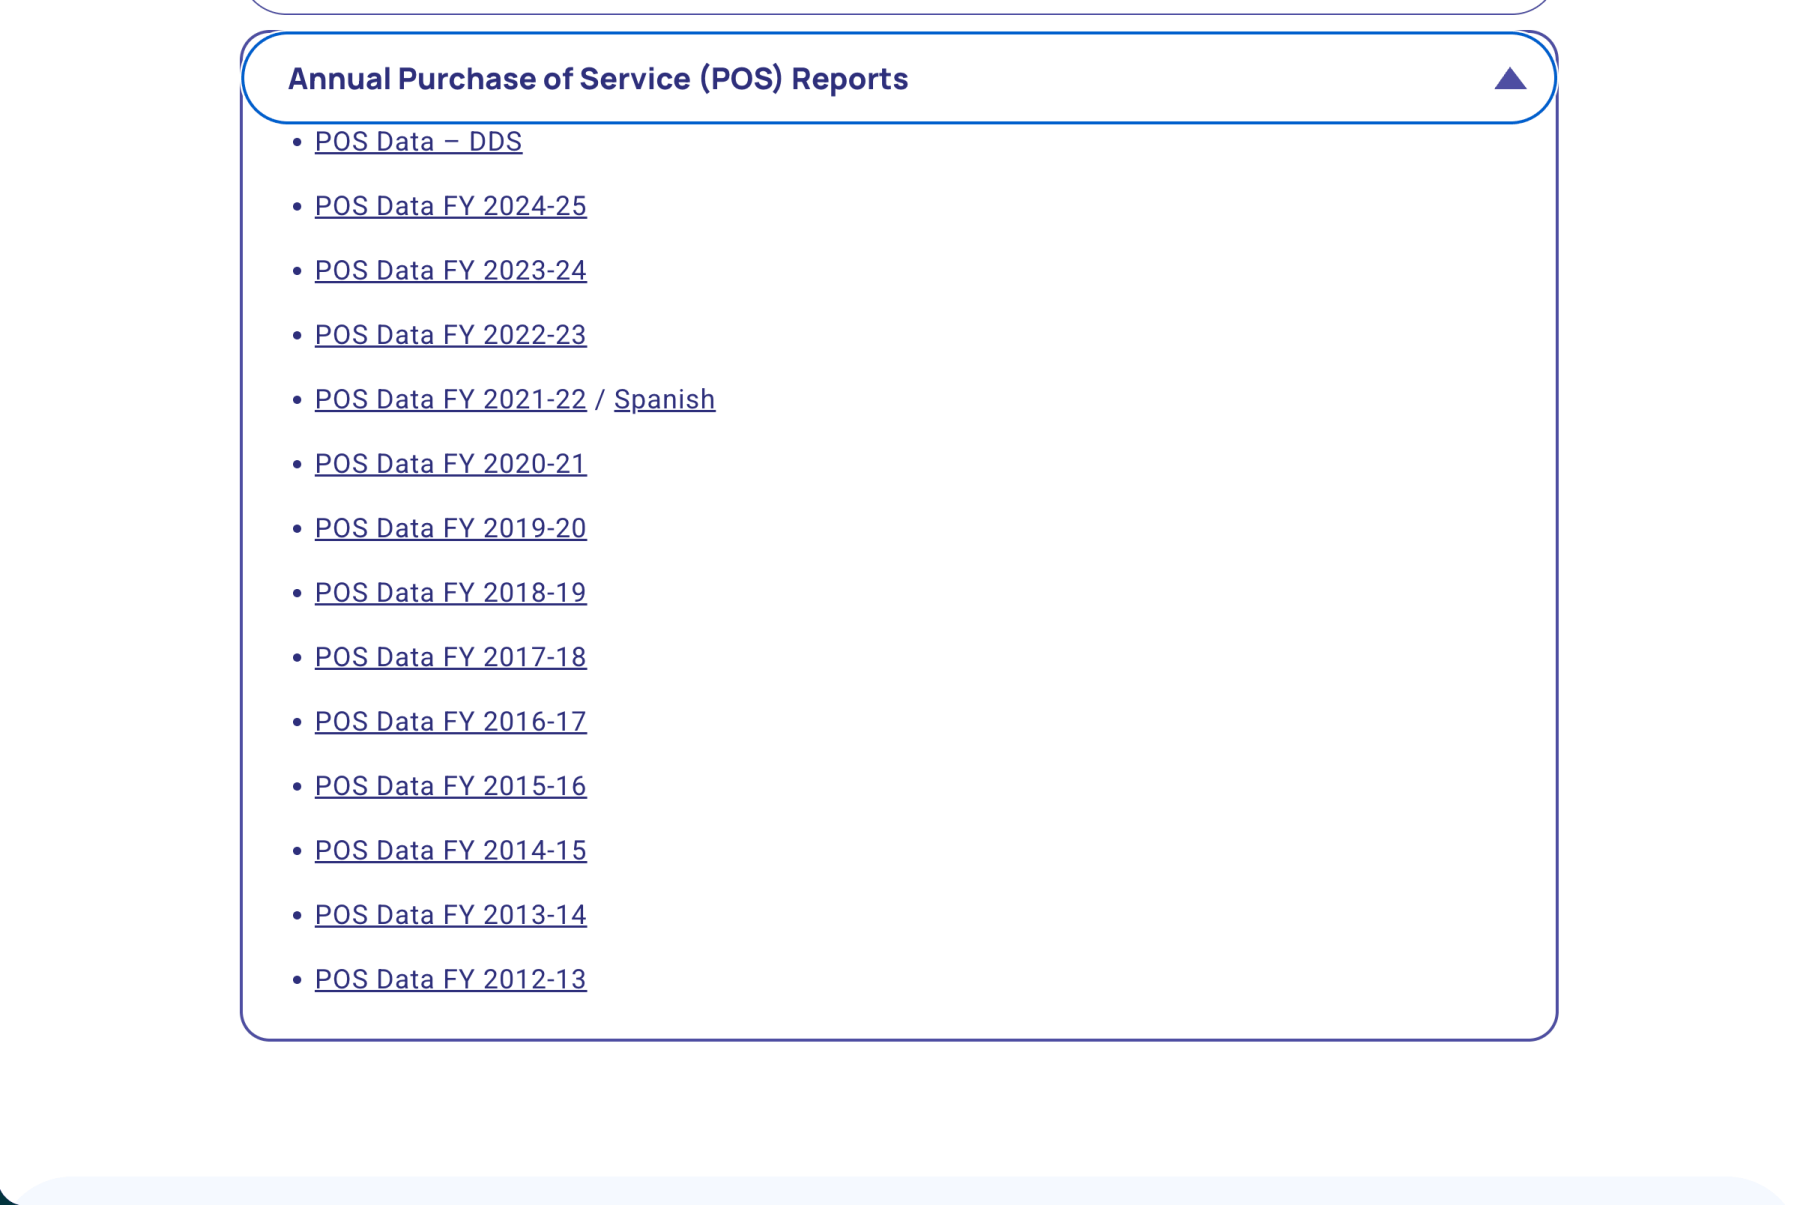
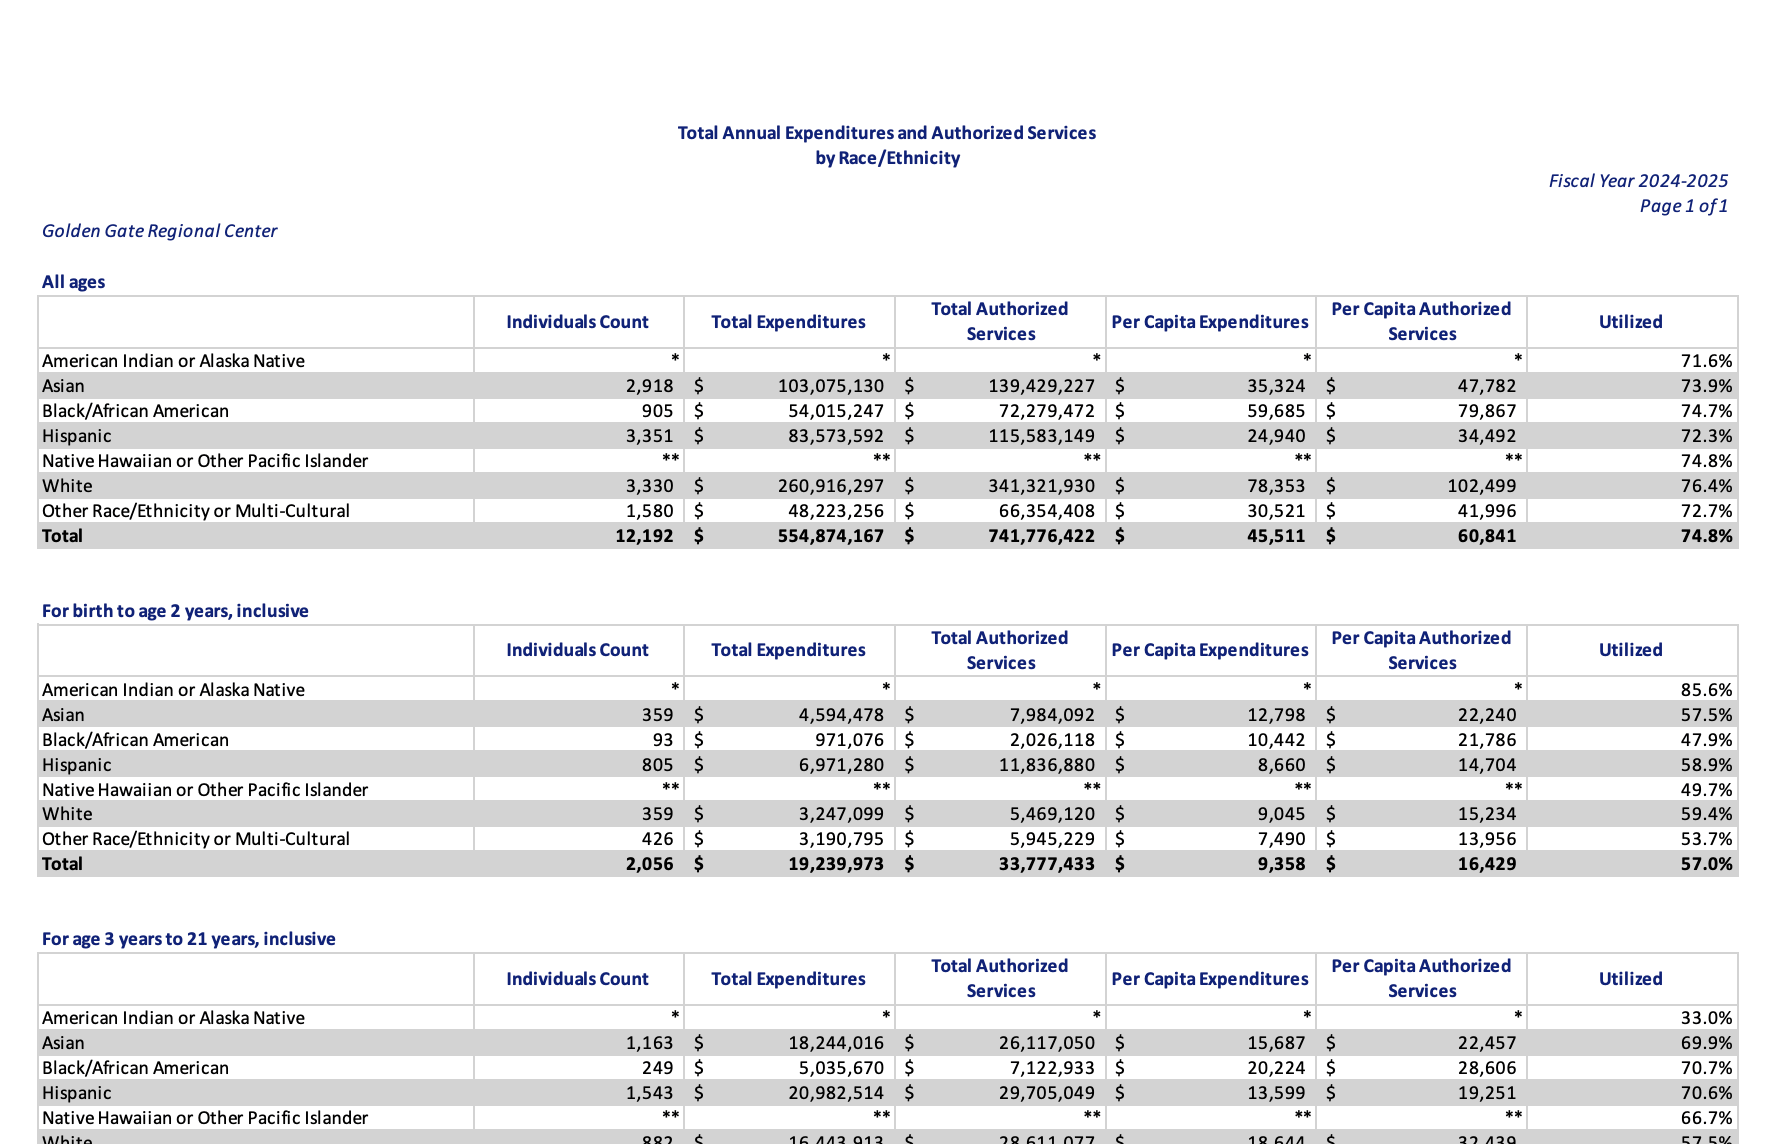
GGRC’s transparency page lists POS reports going back to 2012, all as PDFs. This link opens the most recent one directly, or use the button above to browse past years.
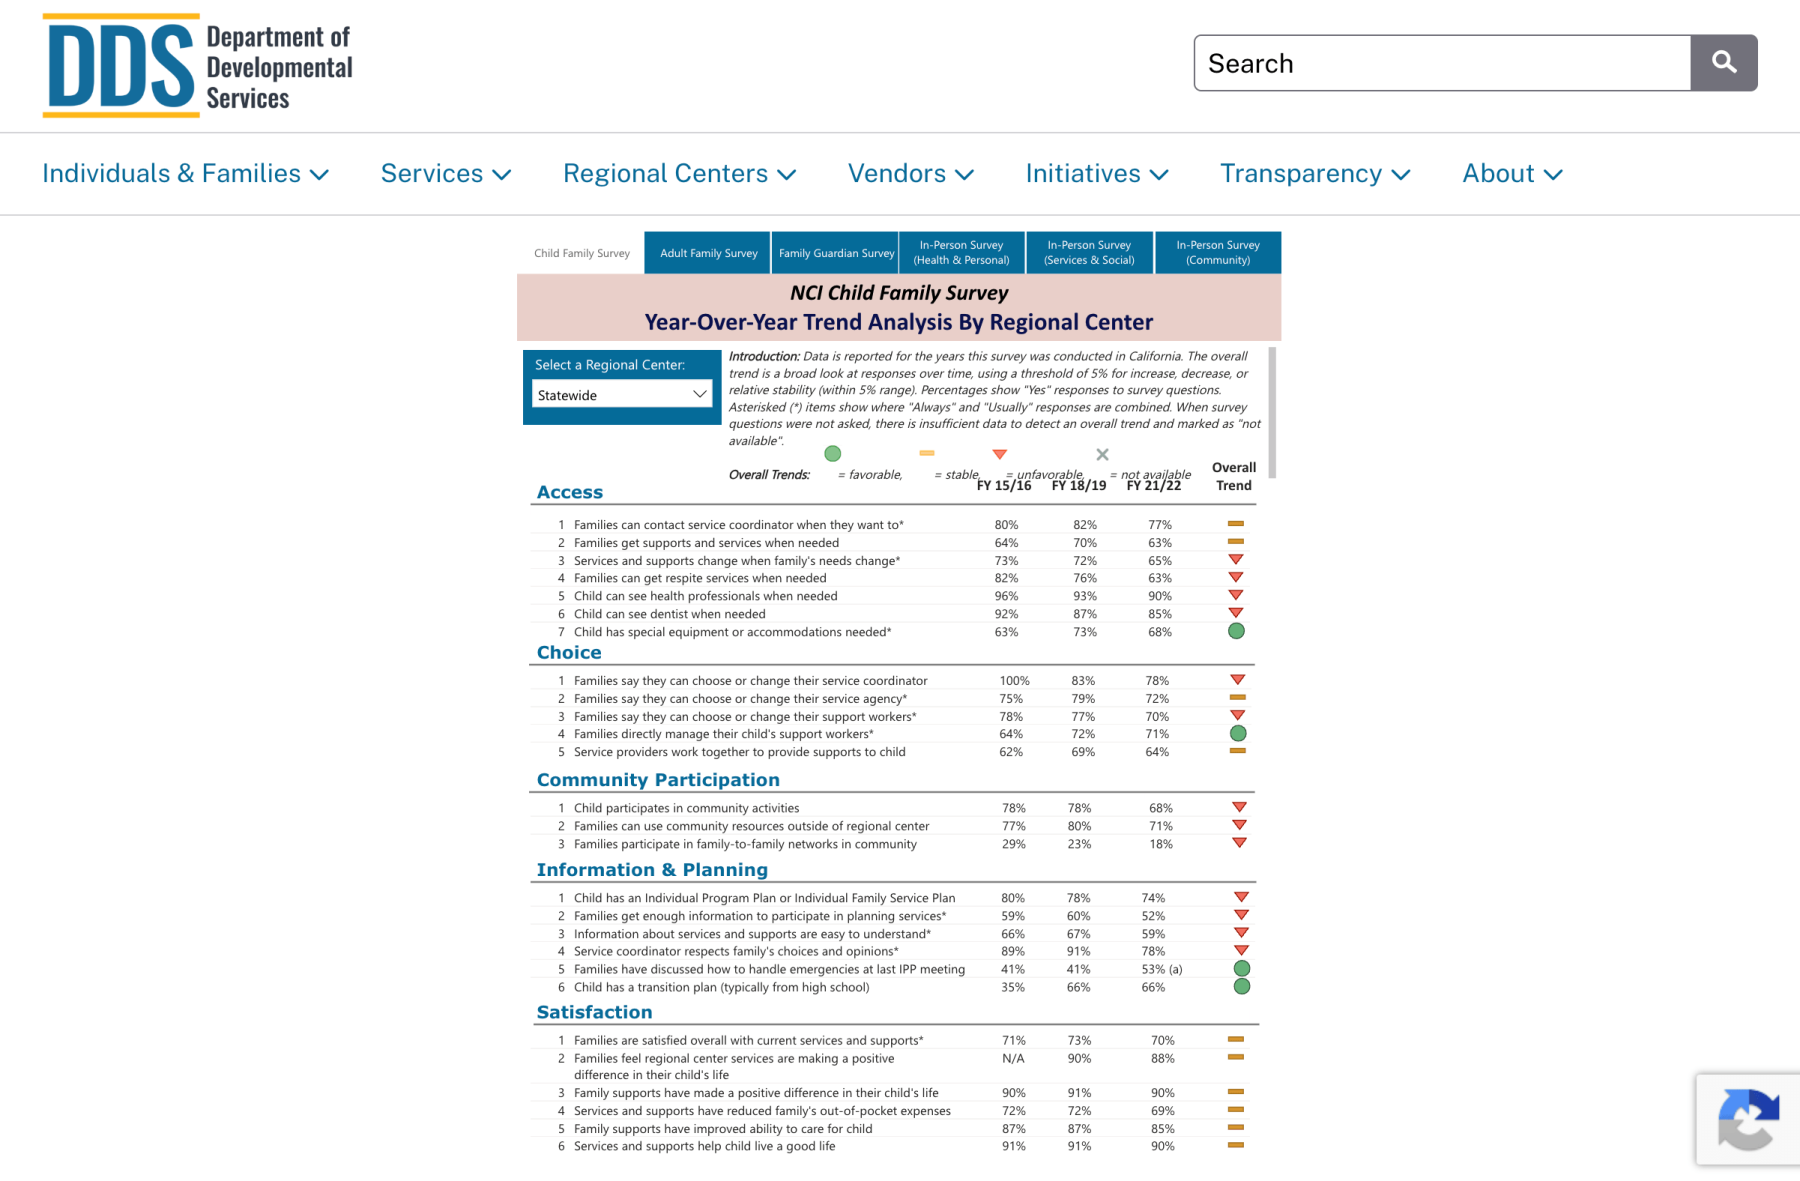
Child Family Survey (CFS) Year-Over-Year Domain Dashboard
View survey data showing feedback from individuals and families served by the regional center about the type and quality of services they are receiving.
The dashboard opens with statewide data. Choose “Golden Gate” from the “Select a Regional Center” dropdown to see GGRC results.
Help Shape This Page
What Data Do You Use?
This index is a starting point. We want to hear which data sources you rely on, what’s missing, and what questions you’re trying to answer, so we can make this more useful for supporting children with special health care needs in San Francisco.